Plotting
Plan of the Week: March 30 - April 5, 2026
High- level outline for the week. Adjusted daily to reflect progress of the day before
- Moving forward.
Monday - Catch up on UW-RUA and NWS Poster
Tuesday - UW-RUA, No Science
Wednesday - Biomarker Manuscript
Thursday - Biomarker Manuscript
Friday - NWS Symposium
Saturday - Biomarker ManuscriptSunday - No Science
Plan of the Day
Granular level task list to accomplish the high- level goal outlined above
- Keep the methylation analysis moving forward
- Biomarker visualizations
Projects Touched Today
- DNA Methylation
- Mussel Biomarkers
Progress Notes
- Today’s working window is limited because it is Easter and I have Easter bunny, Easter chef, Easter everything duties.
- First checked in on the methylation extractions. They’re still running and looking good for what I understand at this moment.
- Tried to rsync and failed again- getting an error that my directory isn’t found. I triple checked the syntax, double checked my passwords, verified the location and paths, double checked gannet… I will check again when I’m less frustrated to make sure I’m not overlooking a simple error.
- Shifted over to the biomarker plots from yesterday.
I realized most of the plotting for the manuscript does not align with the narrative, so I prioritized the manuscript plots (IBR scores, contaminant indices, maps), identified the extraneous plots (transformed data before IBR creation, contaminant plots that are redundant because of the maps, radar plots), and moved over to the tables to do the same thing. The only two tables that are important are the correlation tables, the rest are supplementary.
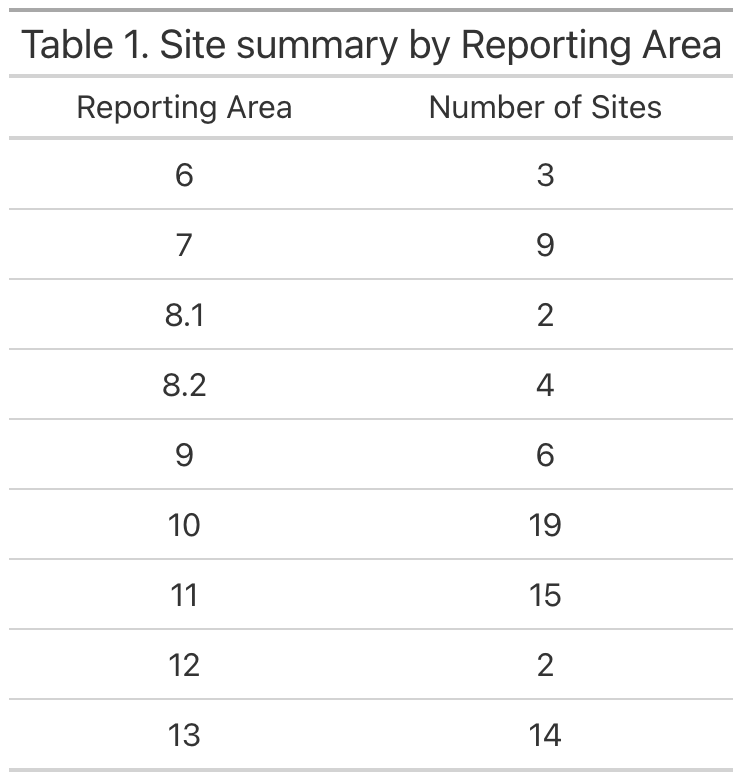
Worth note, because there are 74 sites, these plots are created at the reporting area level for ease of understanding and the larger take home message clarity. The non-map plots are all box and whisker plots with the individual site data indicated as points.
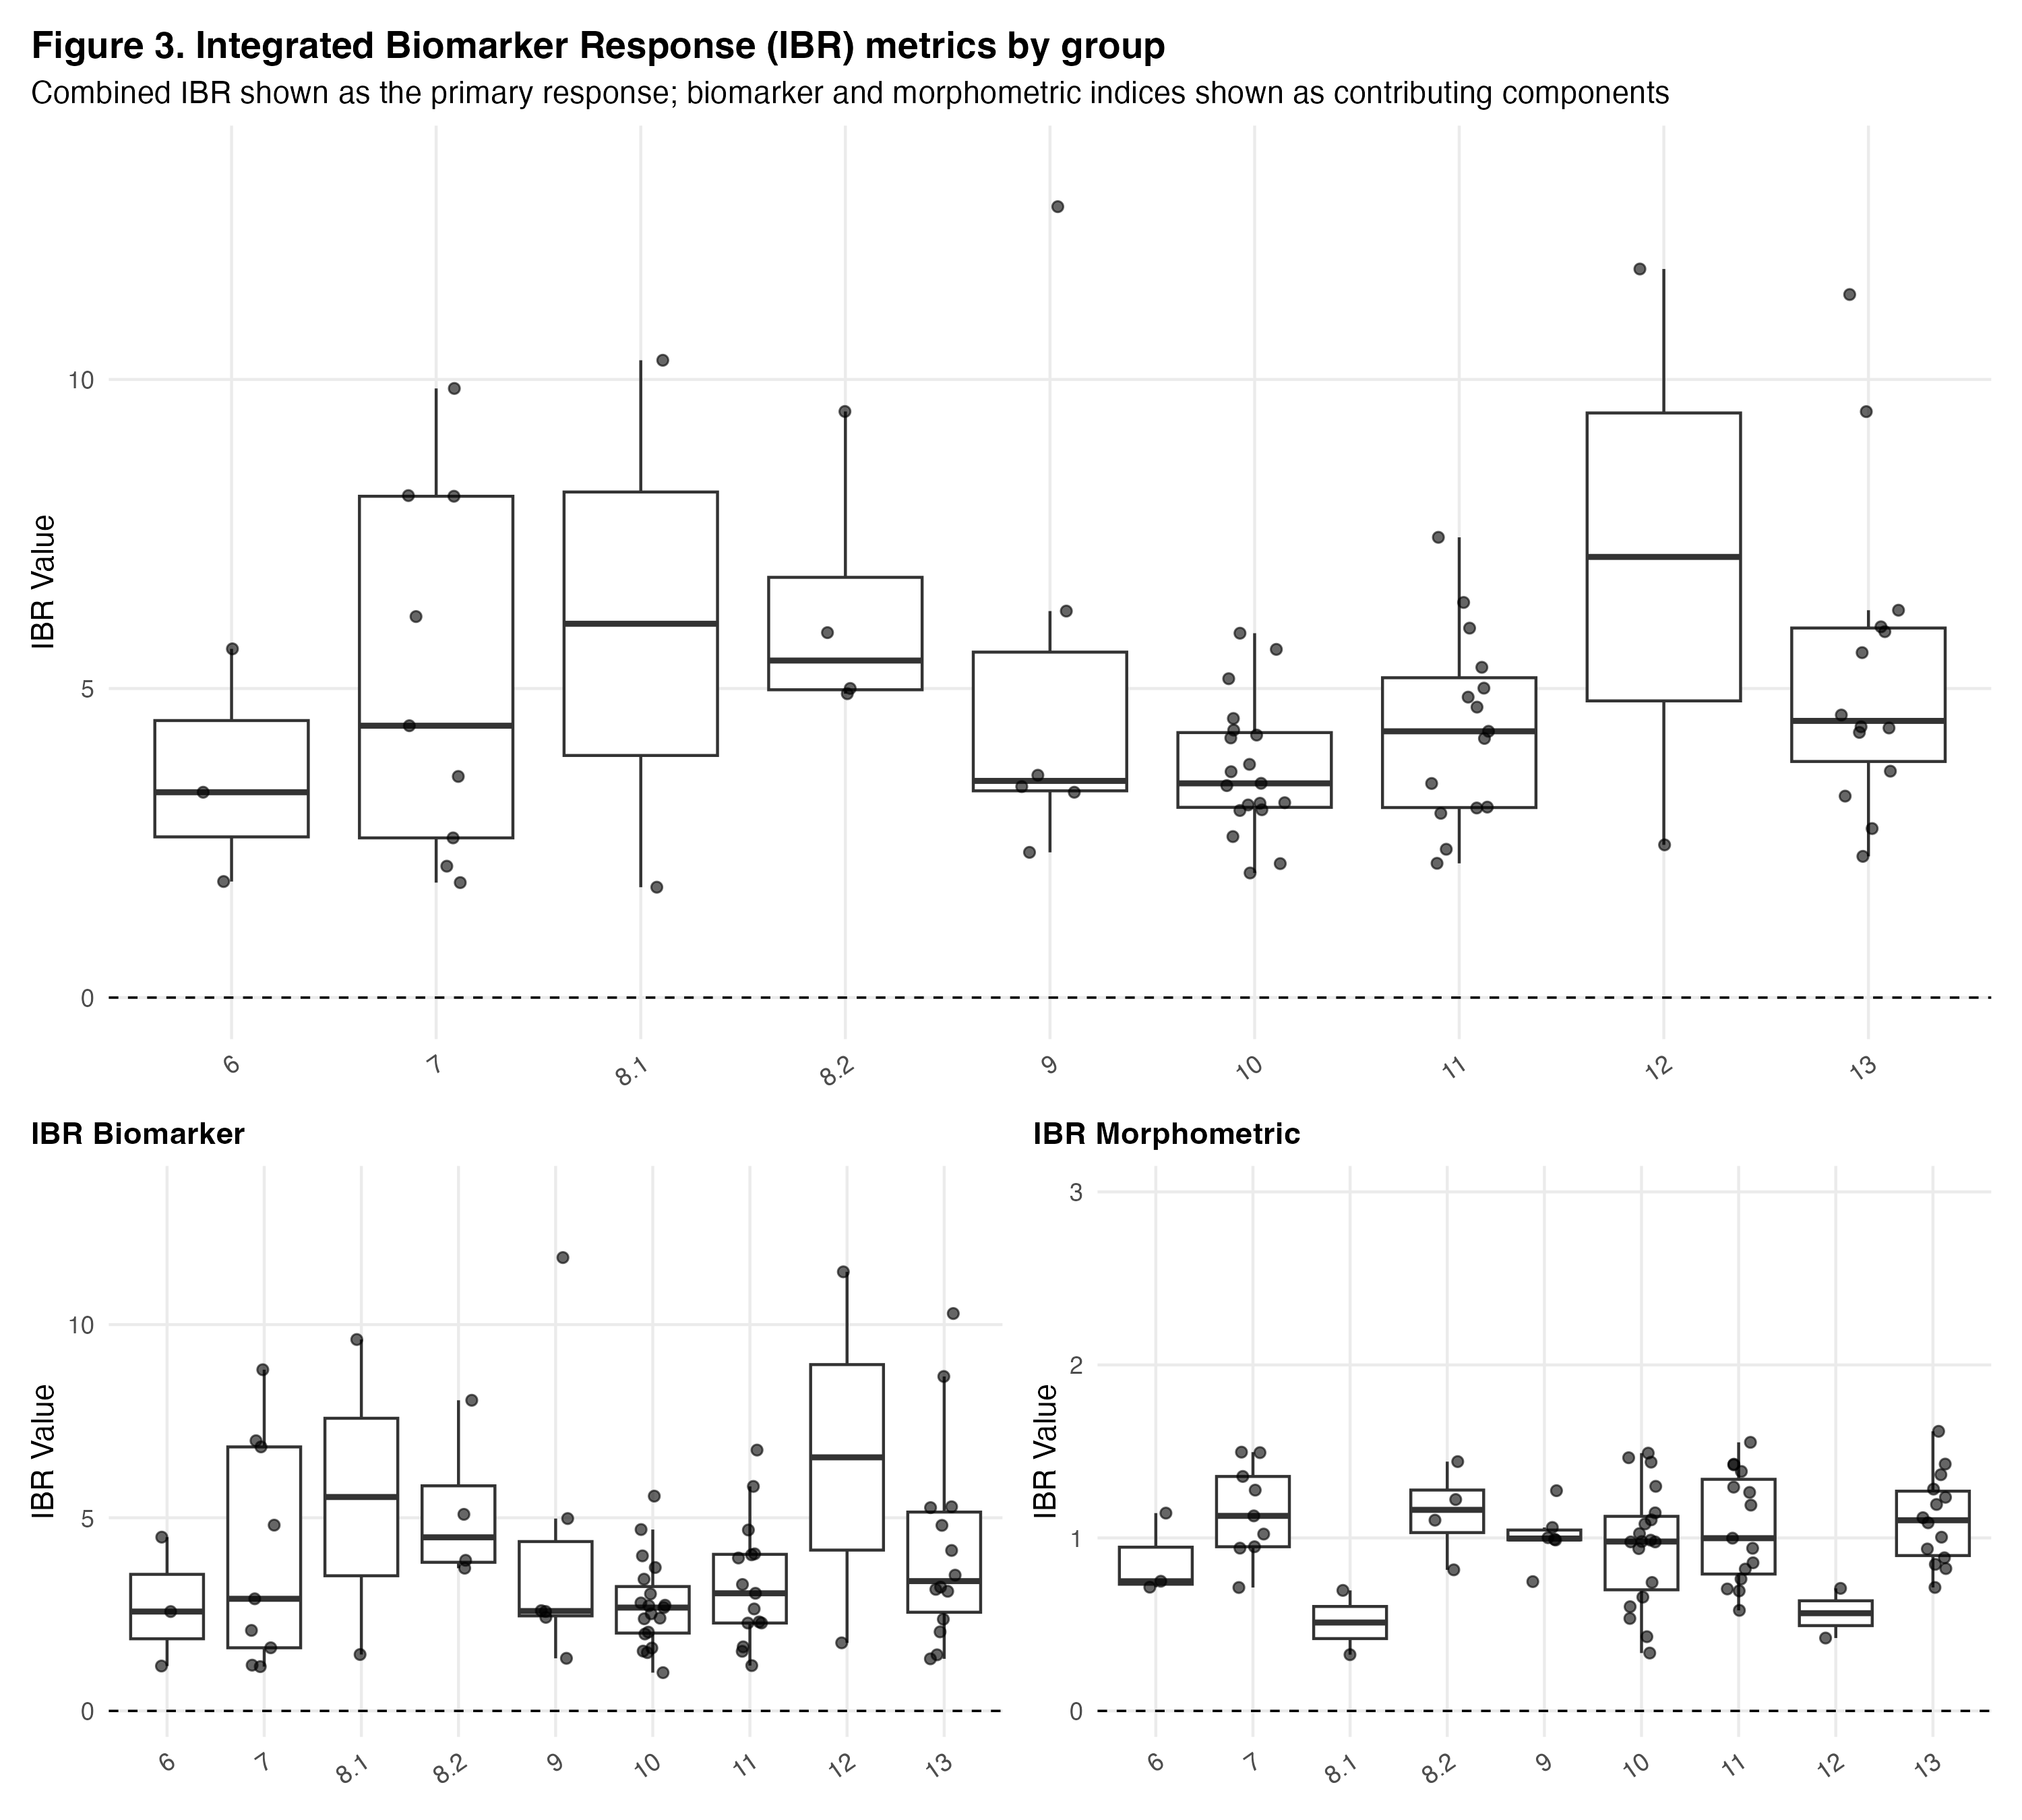
First up, reviewing where I left off on the IBRs since I got the multi-panel layout setup but stopped before reviewing the axes, labels, take home message alignment.
The goal of this plot is to keep the combined score front and center since the analysis is based on that, and then to show how the biomarkers and morphometrics contributed to the combined score.
I didn’t mess with the labels because they are currently good enough for what I need.
I will need some feedback on how to handle the outliers that are compressing the graphs themselves into negligible boxes.
Shifting to the kable() package makes an easily formatted table with almost no effort, like the one below. Most notably, this table is important becasue of the variability in site number - it is something I have not spoken to re: manuscript, but will have to. Additionally, the outlier problem is clear in the IBR plot (below).
Outcomes: Products & Word Count
- Refining plots: 4 plots
Today’s total: 0 words
Monthly total to date: 921 words
Annual total to date: 33,593 words
Annual target total to date: 47,000 words
Next Up: Tomorrow’s Plan
- Set April goals and attainment plan, begin to frame my 1v1 with Steven for Wednesday.