Mapping Biomarkers: Spatial Analyses and Mapping in QGIS and R
mussel biomarkers
qgis analyses
mapping
Projects Touched Today
- Mussel biomarkers
Plan of the Day
- Complete spatial analyses in QGIS and R, complete mapping for the biomarker manuscript and supplement, and possibly get back to working on the resazurin analyses.
Progress Notes
- Today’s work started with drafting presentation text for our Student Technology Proposal: PromethION 2 Solo: Advancing UW Genomics Research Through Enhanced Access to High-Quality Long-Read DNA Sequencing. The proposal is being led by Mike Sadler in Oceanography. We have 3 minutes to pitch our submission followed by 10 minutes of Q&A from the panel, so it has to be clear and quick.
After that, I spent my work block with KPJ reworking the spatial analyses for all metrics in QGIS and confirming in R so I can build the tables to be plotted on the maps succinctly.
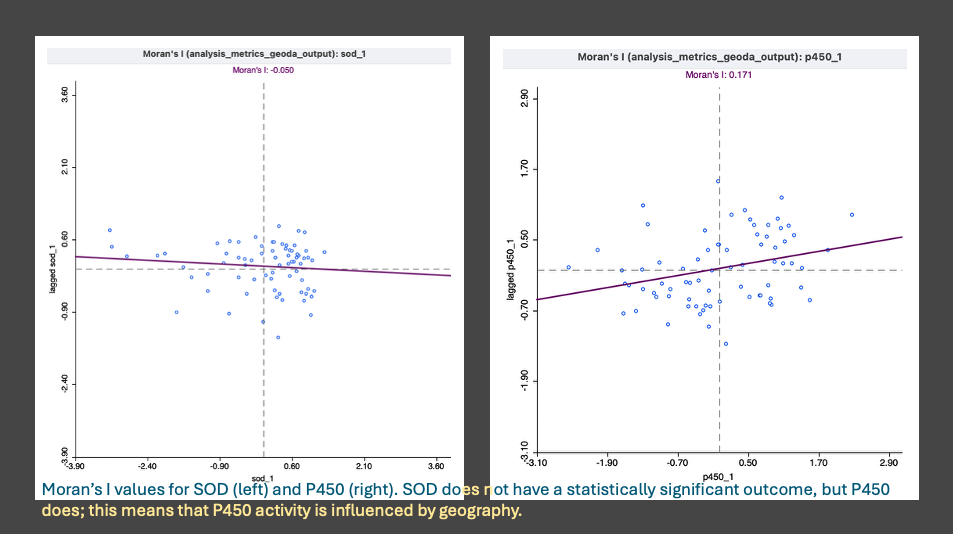
- Picking up from the p450 and sod analysis from the day before, I plotted the results on a scatter plot to confirm no self- autocorrelation across the sites and was pleased to see it worked!
- I continued with the Global Moran’s I analysis for the remaining 17 metrics, there are 19 metrics not 20- I misspoke in yesterday’s post. Global Moran’s was run first because the results answer the question of whether or not there is a statistically significant spatial structure to the measured metrics (p450, sod, shell thickness, condition index), the integrated response indices (IBR biomarker, morphometric, combined), and the contaminant indices (chlordanes, ddt, hch, metals, 4 pah groups, pbde, pcb, pesticides, and total contaminants).
- Next up was the ‘local moran’s’ also known as LISA (local indicators of spatial autocorrelation). Since there were 9 metrics indicating a ‘global’ significance, the LISA test tells us what kind of spatial structure exists and if the pattern is consistent across the metrics.
- While I don’t expand this into a connection to the physical geography of each of the sampling sites, that can be easily done as a point in the Discussion/ Conclusion of the manuscript or left to assess at a later time.
Once I had the QGIS results, I then went back to see if I could fix the errors I made in R to replicate the results. The main reason is to confirm the outcome, and the secondary reason is to create data tables of the results that aren’t GeoPackages so they can be used to plot, build a supplementary spatial results table, and export as a csv in the correct format.
- Rather than try to adjust the existing markdown script, I built the script from the beginning, paying special attention to the conversion from coordinate (degrees) to a distance matrix that matched the QGIS matrix.
- I ran an analysis of variance between the ‘clusters’ and used the K Nearest Neighbors statistical grouping of geographic groups to continue the analysis. My last attempt used K-Means Clustering, which is not effective in non-normal data since it is built on response variables, not geographic location first- something that was very unclear in my earlier understanding of the test. The K-NN test resulting in an n=6 that was statistically significant and balanced the number of sites per group.
- Once that was established, I spent a ridiculous amount of time building a loop to assess all of the metrics for each test. With the help of ChatGPT, I found that I was building the function sandwich in the wrong order… should have just checked that earlier.
- The outputs of each of the tests were saved as csv’s, then only the statistically significant results were saved in another csv. Those outputs were then joined to the full csv of identifiers (site number, site name, lat/ long) and metric values, converted to GeoPackages for mapping, and added to QGIS for visualization.
I felt very comfortable in stopping at this point since I was making silly mistakes reviewing them in QGIS - time to throw in the towel for the day.
Tomorrow’s Plan
- Continue mapping the spatial results.